LaSWE was developed as a visualisation platform to enable the users easier access to
summarised information pertaining to their countries susceptibility to wind erosion, as well as charts and statistics.
LaSWE system provides the user with the liberty to access modelled outputs at a click of a button, while communicating complex scientific
information in a manner that can be understood easily, by both users and policy makers.
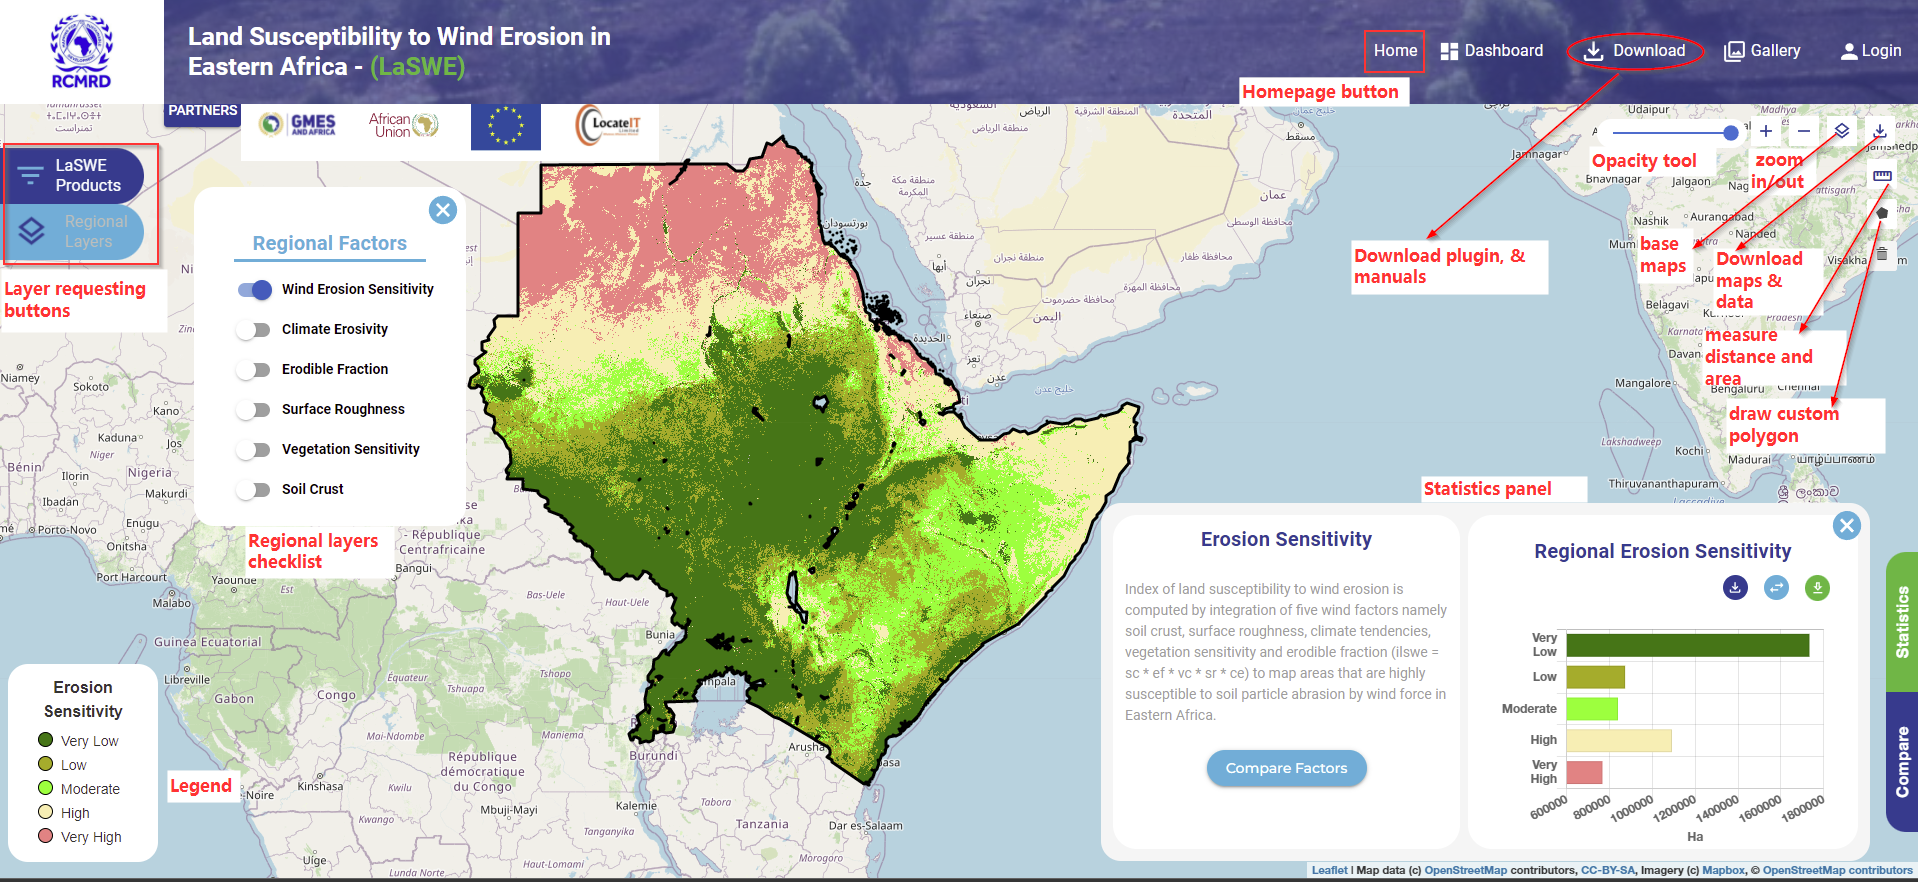
LaSWE system has various components as shown in the following sections.
The snip below shows some functionalities of the system. The user can access various features while navigating with the
tool-buttons shown in the below.
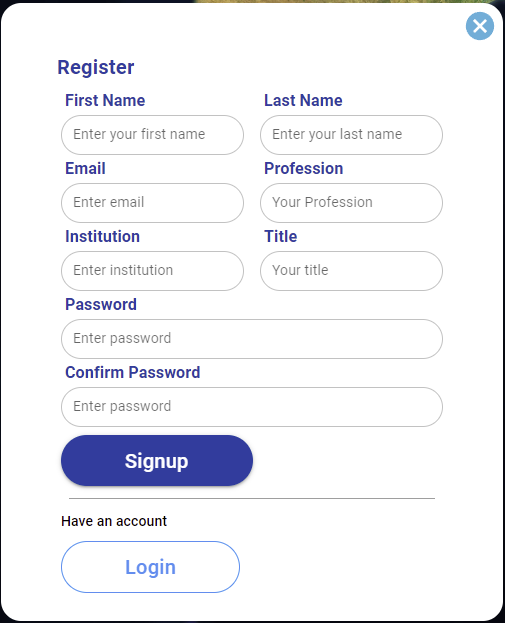
This allows a user to log in or create an account.
The user is allowed to become a registered user, this is in preparation towards enabling a user provide feedback in case
of any reporting and feedback.
Registration also enables monitoring of the number of users for the system, and assess impact to the end users.
A user is required to enter their details in the form shown above.
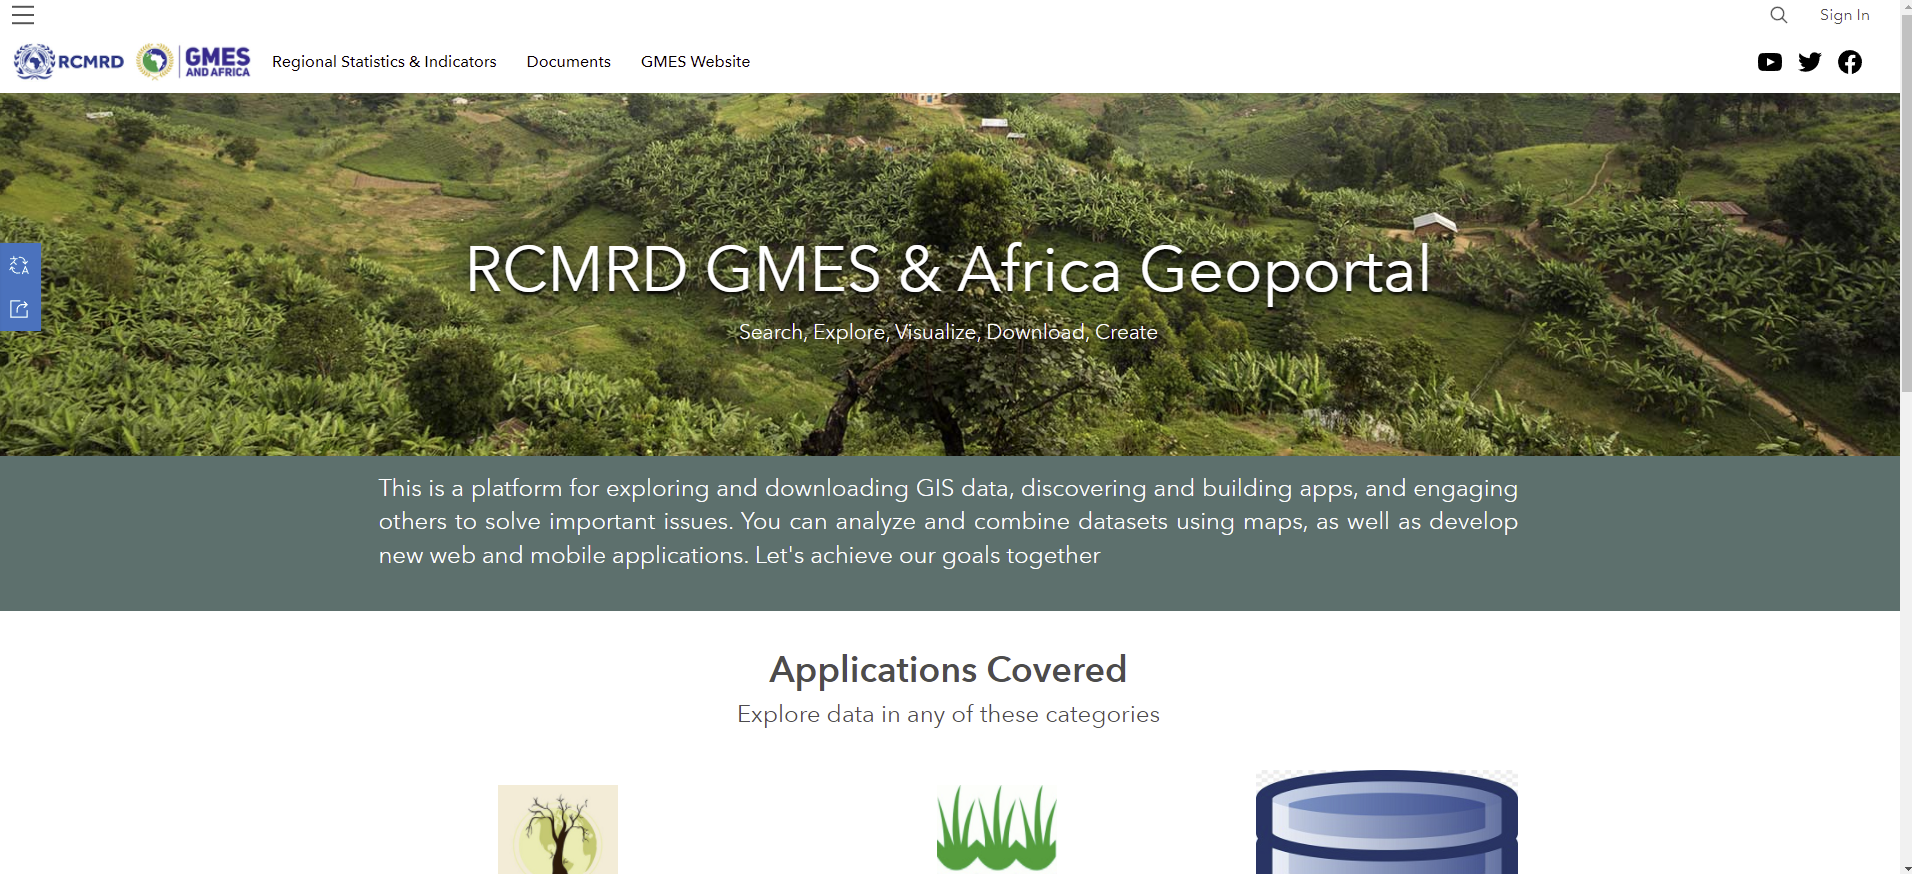
System gallery gives users a pipeline to provide feedback to the system maintenance team.
In other occasions, the gallery will be used to give ground truth information inform of images and descriptions that will be shared in the gallery section.